Preview and Test Flows
Lucy Player lets you see the pages you build in Lucy Studio on a real device, live, as you edit. It runs on iOS, Android, Windows, and macOS.
Connect Lucy Player to Lucy Studio
-
Download Lucy Player from either the App Store or Google Play Store.
App Store (iOS)

Google Play (Android)

-
Click the Login button and log in with your Lucy Platform account.
-
After you log in, your device appears in Lucy Studio's device list. Click the plus icon next to the device you want to connect, and it moves to the top of the list.
noteIf Lucy Player and Lucy Studio run on the same computer, Lucy Studio finds and connects to Lucy Player automatically.
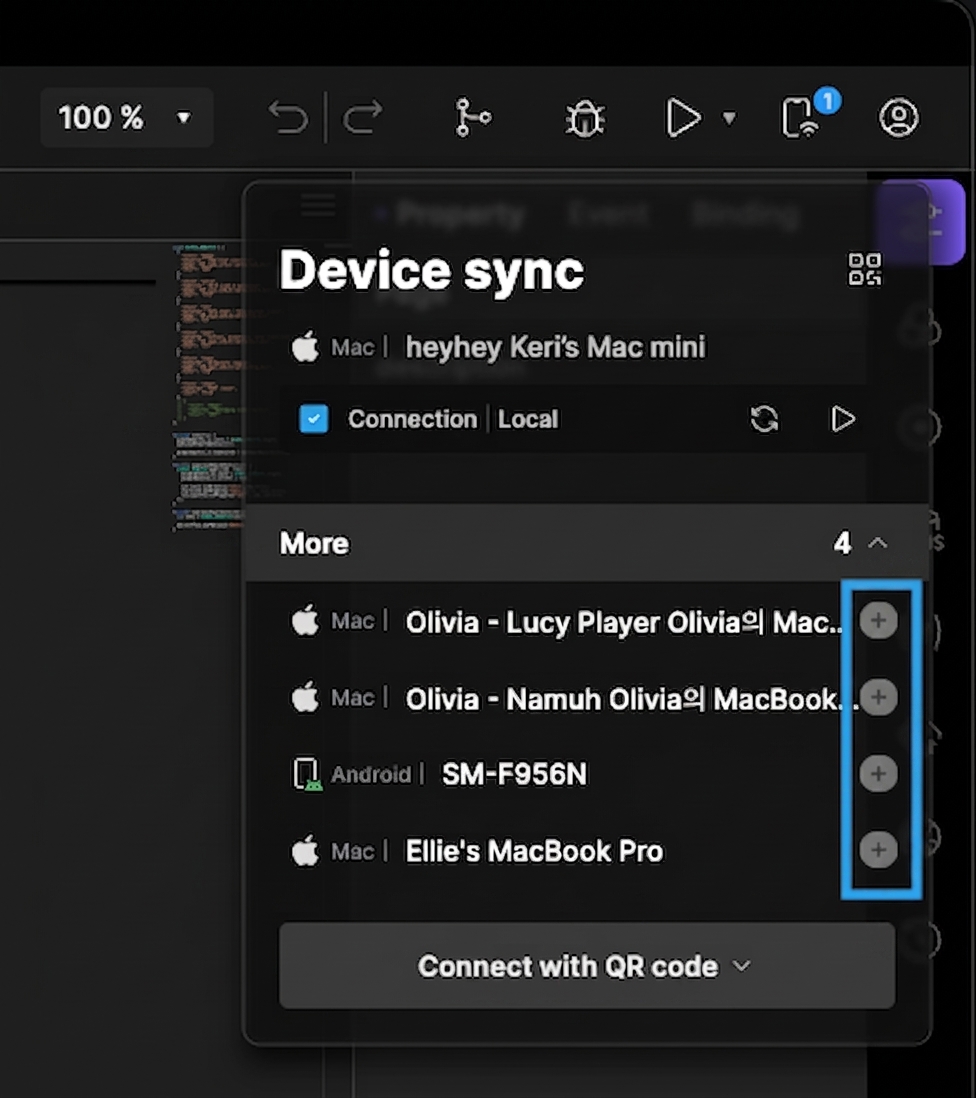
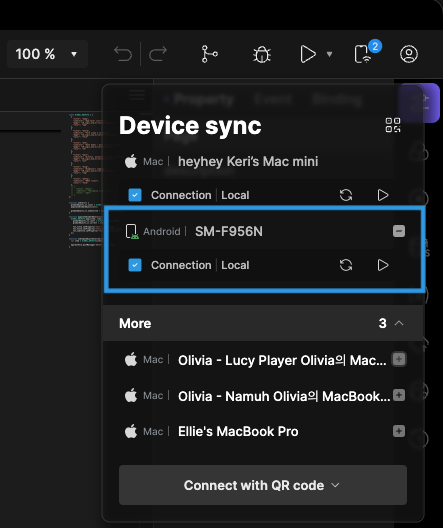
- If you can't find your device in the list, tap Connect with QR code in Lucy Player.
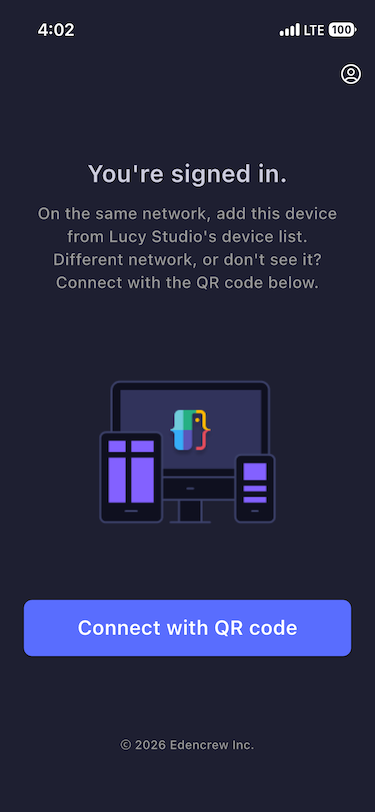
-
In Lucy Studio, open the Studio Connector dialog to display the QR code.
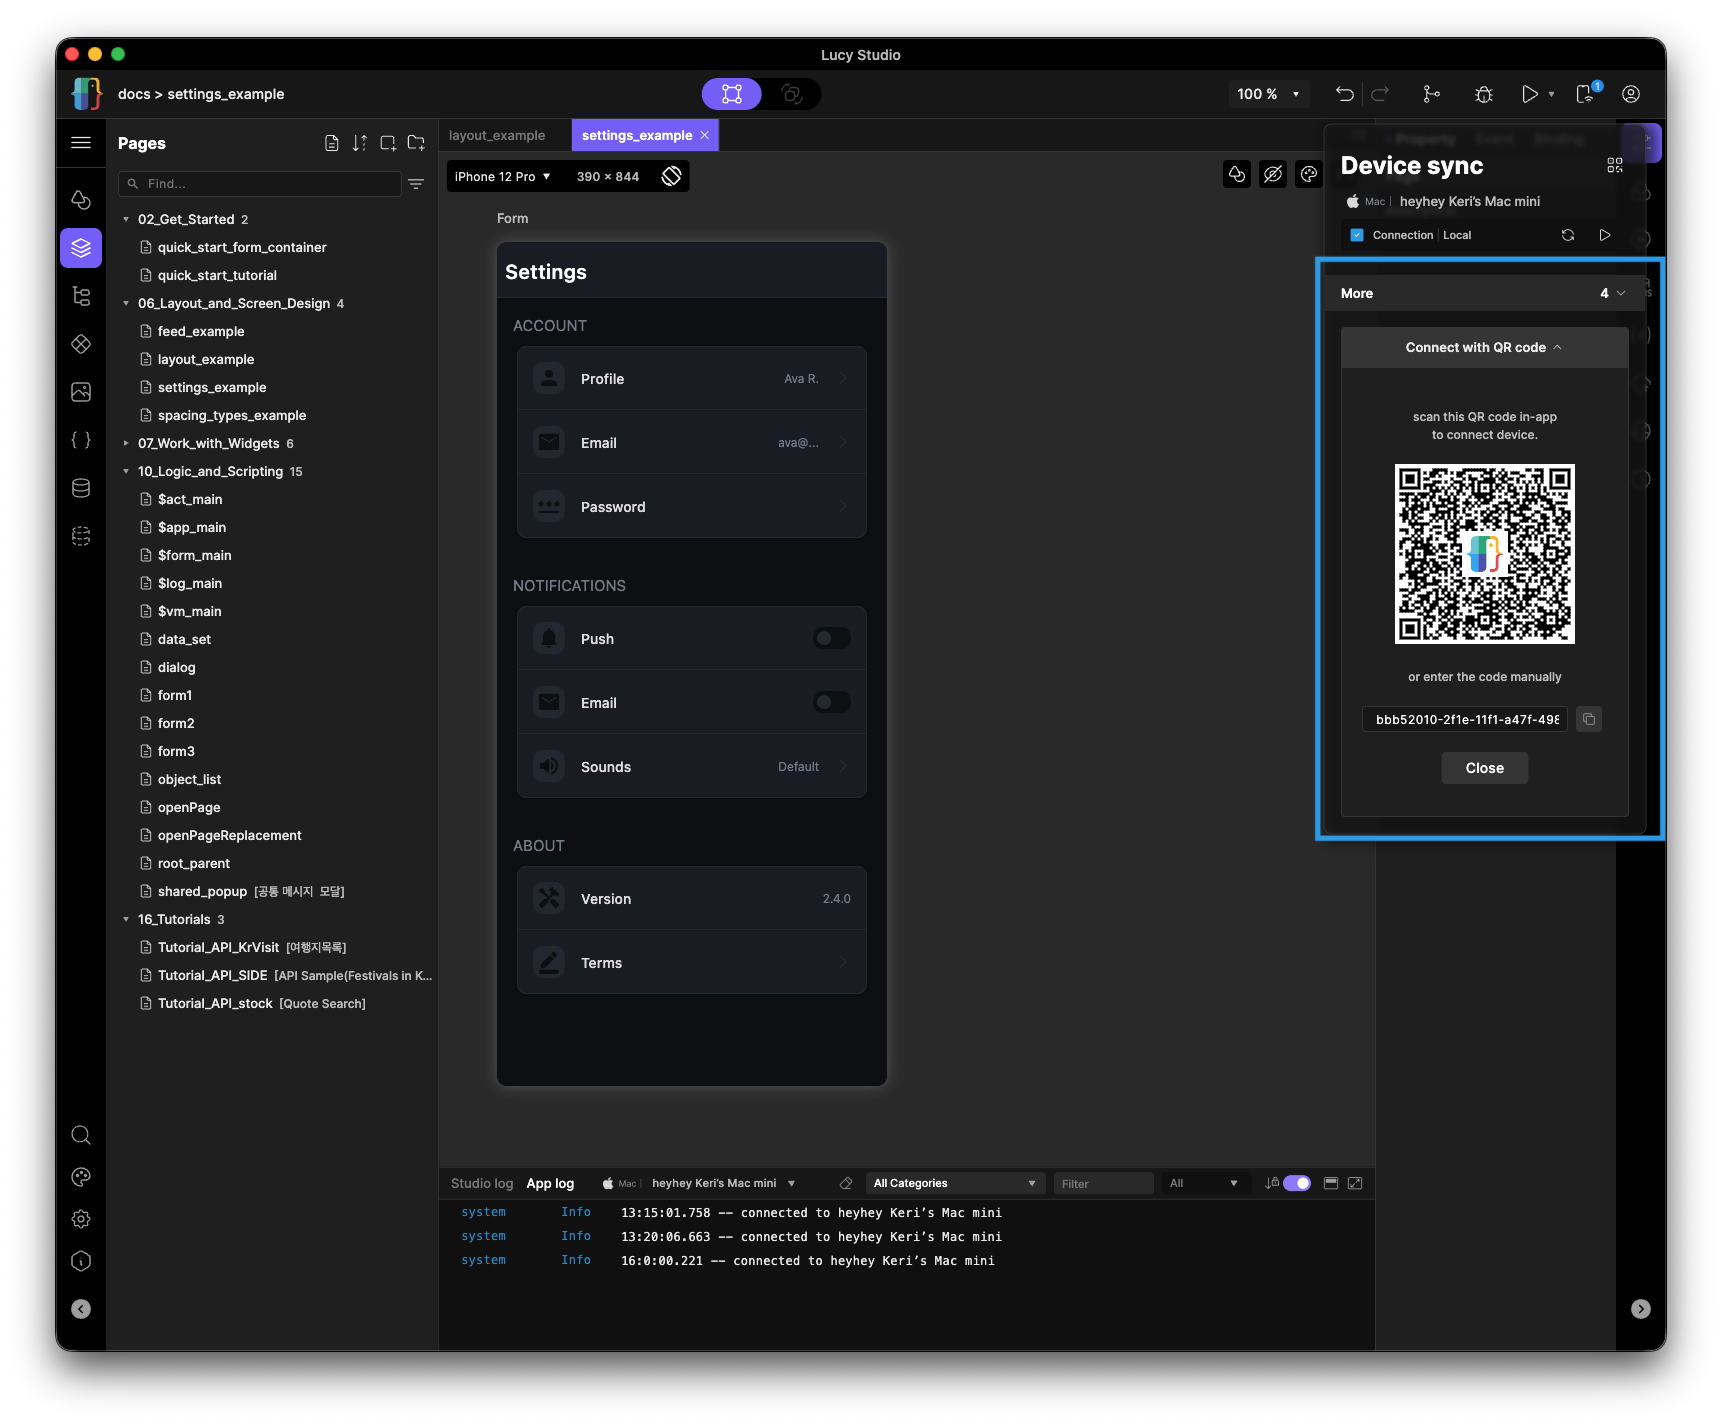
-
Scan the code with Lucy Player. Once connected, the screen below appears. To change your device's nickname or connect to Lucy Studio on a different device, tap Manage connection.
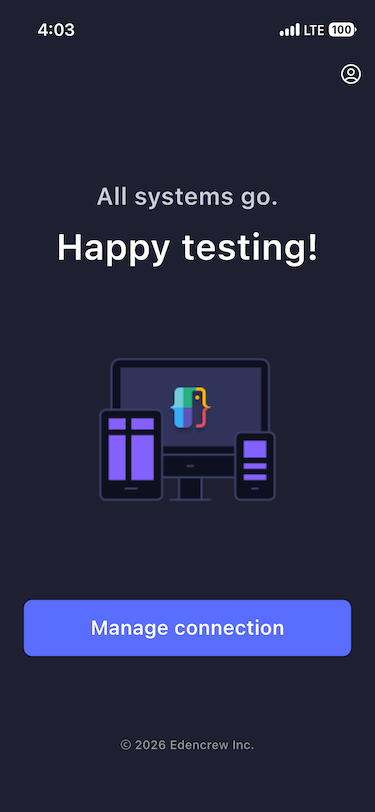
Live preview and testing
-
Once connected, any edit you make to a page in Lucy Studio can be sent and tested immediately in Lucy Player.
-
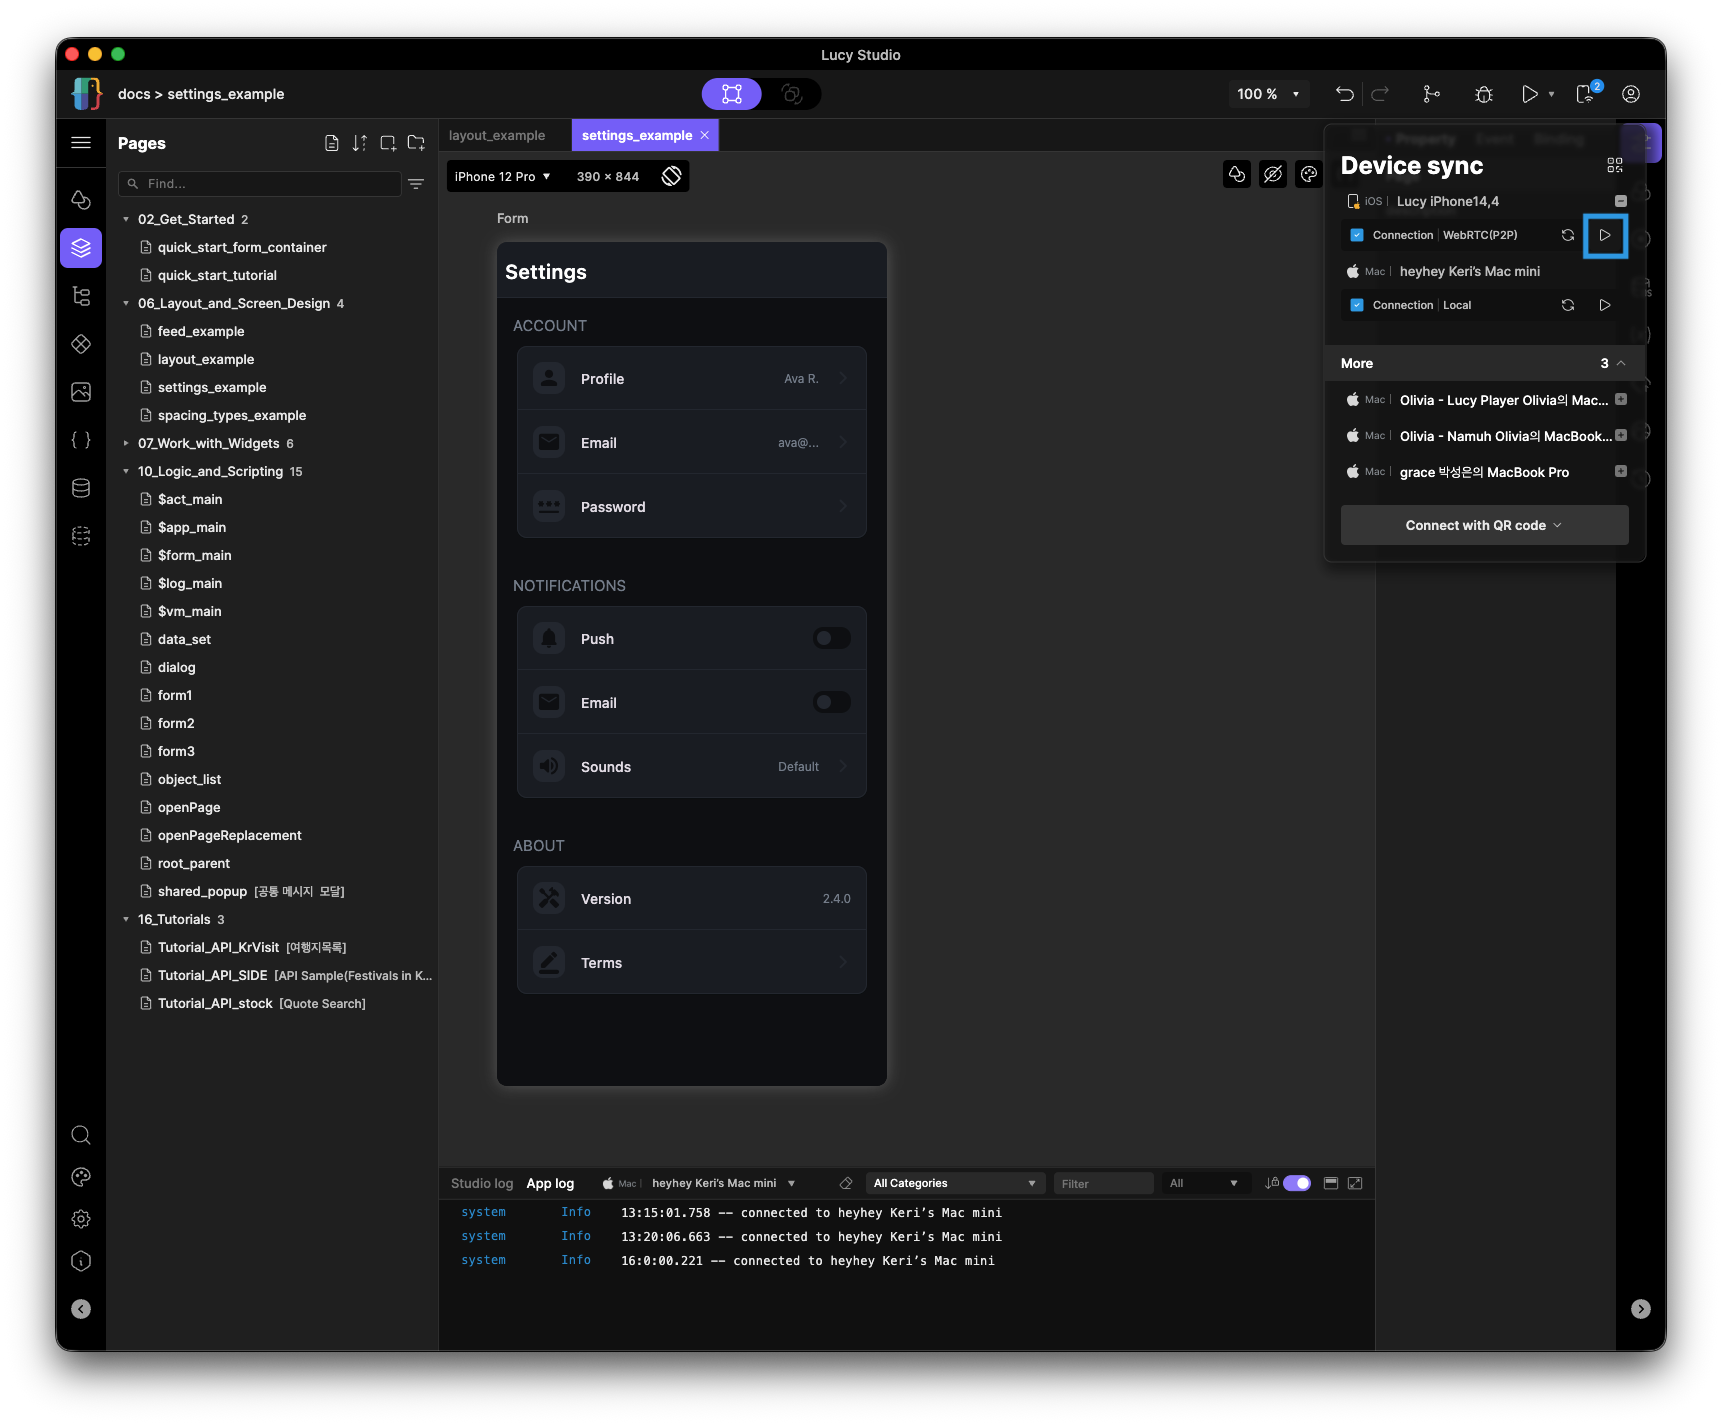
If more than one Player is connected, choose which device to send the screen to.
-
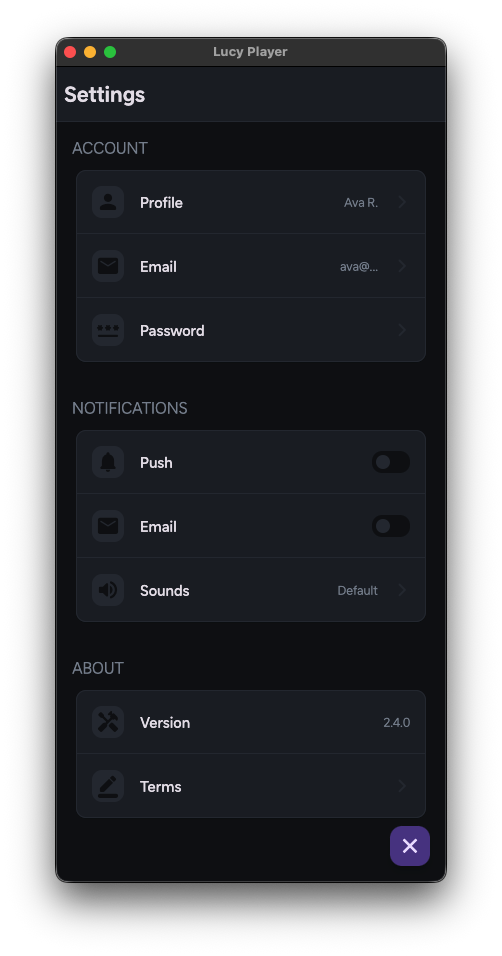
Press the Play button in Lucy Studio's Action bar to push the current screen to Lucy Player.
-
Use this live connection to test your app's flow end-to-end — navigate between pages, trigger interactions, and confirm your screens behave as expected on a real device before shipping.
Use Logs and Console Output
The Logger Panel
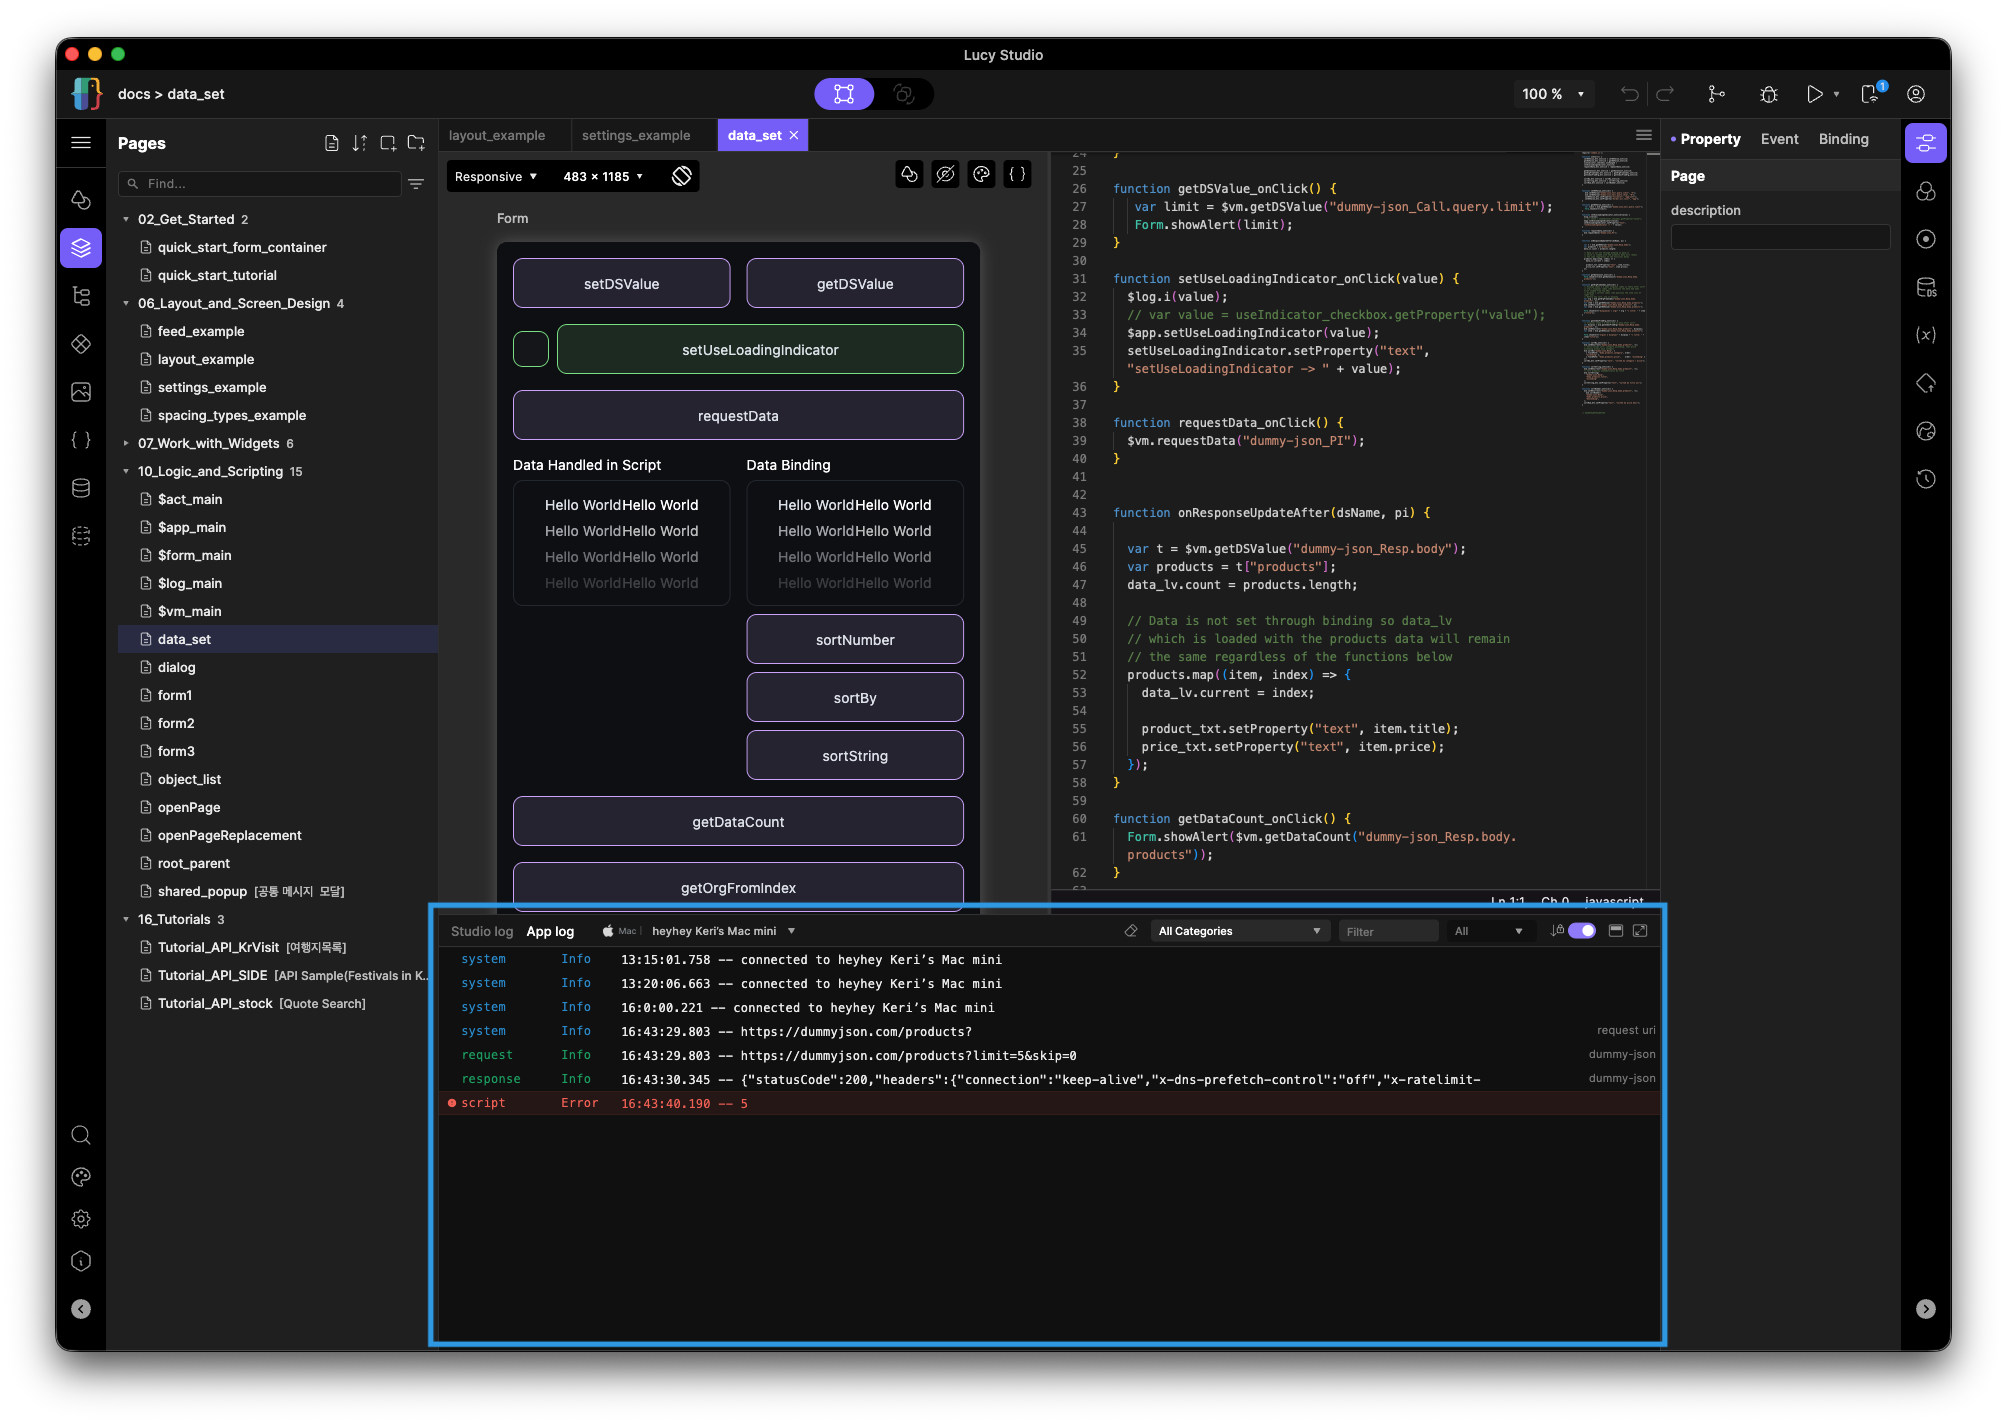
The logger panel sits at the very bottom of Lucy Studio. It is where all console output appears during preview and runtime — this includes script logs you write yourself, HTTP request and response data, DS update events, and script errors.
Each log entry shows a timestamp, a level indicator, and the message. You can clear the panel between test runs to keep the output readable.
Logging from Script with $log
The $log global object gives you four logging methods, one per severity level:
| Method | Level | When to use |
|---|---|---|
$log.d() | Debug | Detailed tracing during development |
$log.i() | Info | Confirming expected events (e.g. data loaded) |
$log.w() | Warn | Something unexpected but not fatal |
$log.e() | Error | A failure that needs attention |
Each method accepts any value — objects and arrays are converted to a string automatically. For full method signatures and parameters, see Logic & Scripting.
Script Error Indicators
The script editor (Monaco) highlights syntax errors inline as you type. Runtime errors — such as calling a method on an undefined variable, or a type mismatch — appear in the logger panel when the relevant script runs, tagged as exceptions.
If a button does nothing when tapped, check the logger first before assuming the logic is wrong. For common debugging patterns and known gotchas, see Debug Your Script.